Brand Awareness Measurement: Surveys, Metrics and Results
Learn how brand awareness measurement works: aided and unaided recall, share of voice, reach, and how to read your results and plan content.
Aided recognition can look impressive while spontaneous recall barely moves. In research analyzing brand-tracking data collected from 1999 to 2001, low-salience brands showed substantial variation in aided-awareness scores while spontaneous-awareness scores stayed consistently low, according to this study of awareness measurement and brand salience. That gap is why brand awareness measurement should track different signals separately, rather than treating one recognition percentage as proof that a brand comes to mind.
Table of Contents
- Brand Awareness Metrics and Memory States
- How to Run a Brand Awareness Survey
- Calculating Share of Voice and Reach
- Reading Aided and Unaided Results
- Proving Awareness Lift Beyond Correlation
- Turning Awareness Results Into Content Plans
- Set Your Baseline Before the Next Launch
Brand Awareness Metrics and Memory States
Brand awareness measurement records how many people know a brand, how easily they retrieve it from memory, and how often they encounter it, tracked over time.
| Metric | What It Measures | How You Collect It | Signal Type |
|---|---|---|---|
| Unaided recall | Brands named with no prompt | Open-text category question in a survey | Memory, strictest test |
| Top-of-mind awareness | The first brand named | First answer to an open-text category question | Memory, top position only |
| Aided awareness | Brands recognized from a list, name, or logo | Randomized brand list in a survey | Memory, more permissive |
| Reach | Unique people exposed to brand content or ads | Platform analytics and ad delivery reports | Exposure |
| Share of voice | Your share of category mentions versus competitors | Media monitoring and mention counts | Competitive presence |
| Branded search volume | Searches that include the brand name | Search Console and keyword tools | Active interest |
| Direct traffic | Visits with no referrer, often typed URLs | Web analytics | Loose proxy, includes existing customers |
The table separates two kinds of evidence. Survey metrics measure memory, while media and search metrics measure exposure or interest. A useful measurement program includes at least one from each group, because seeing a brand doesn't prove someone remembers it, and recalling a brand doesn't show how they encountered it.
Read the memory tests from strict to permissive
Think of a shopper scanning a shelf. If they name your brand without seeing a list, that's unaided recall. If yours is the first brand they name after hearing the category cue, that's top-of-mind awareness, a narrower measure of spontaneous retrieval. If they recognize your name or logo only after seeing it among alternatives, that's aided awareness. If they don't recognize it at all, the prompt hasn't established familiarity.
These tests aren't interchangeable. Top-of-mind measures the first brand retrieved; unaided recall captures any brand retrieved without assistance. Aided awareness is the easier, more permissive test, while unaided recall is the stricter test of whether the brand is mentally available without prompting. That distinction is foundational to awareness measurement, as the study of top-of-mind, spontaneous, and aided awareness describes.
Scores reflect both underlying salience and the difficulty of the test. A low-salience brand may register quite differently on aided questions from one wave to another while remaining consistently low on spontaneous recall. That's a reason to report a set of indicators rather than presenting a single recognition percentage as the whole story.
Treat exposure indicators as proxies
Reach tells you how many unique people had an opportunity to encounter a brand, not whether they noticed or remembered it. Share of voice shows how much of the measured conversation belongs to the brand compared with competitors. Branded search points to active interest, but it can also reflect customers looking for support, a product page, or a known destination.
Direct traffic is an especially loose proxy. It includes people who type a URL, but those visits can come from existing customers rather than newly aware prospects. No single metric proves awareness: its value comes from comparing the same measure against a baseline and competitors, using a clearly defined audience and time period.
How to Run a Brand Awareness Survey
A credible tracker depends on asking the questions in an order that doesn't give respondents the answers. The brand-tracking survey guidance separates unaided recall from aided recognition because they test different memory states, and recommends keeping the survey design consistent across waves.
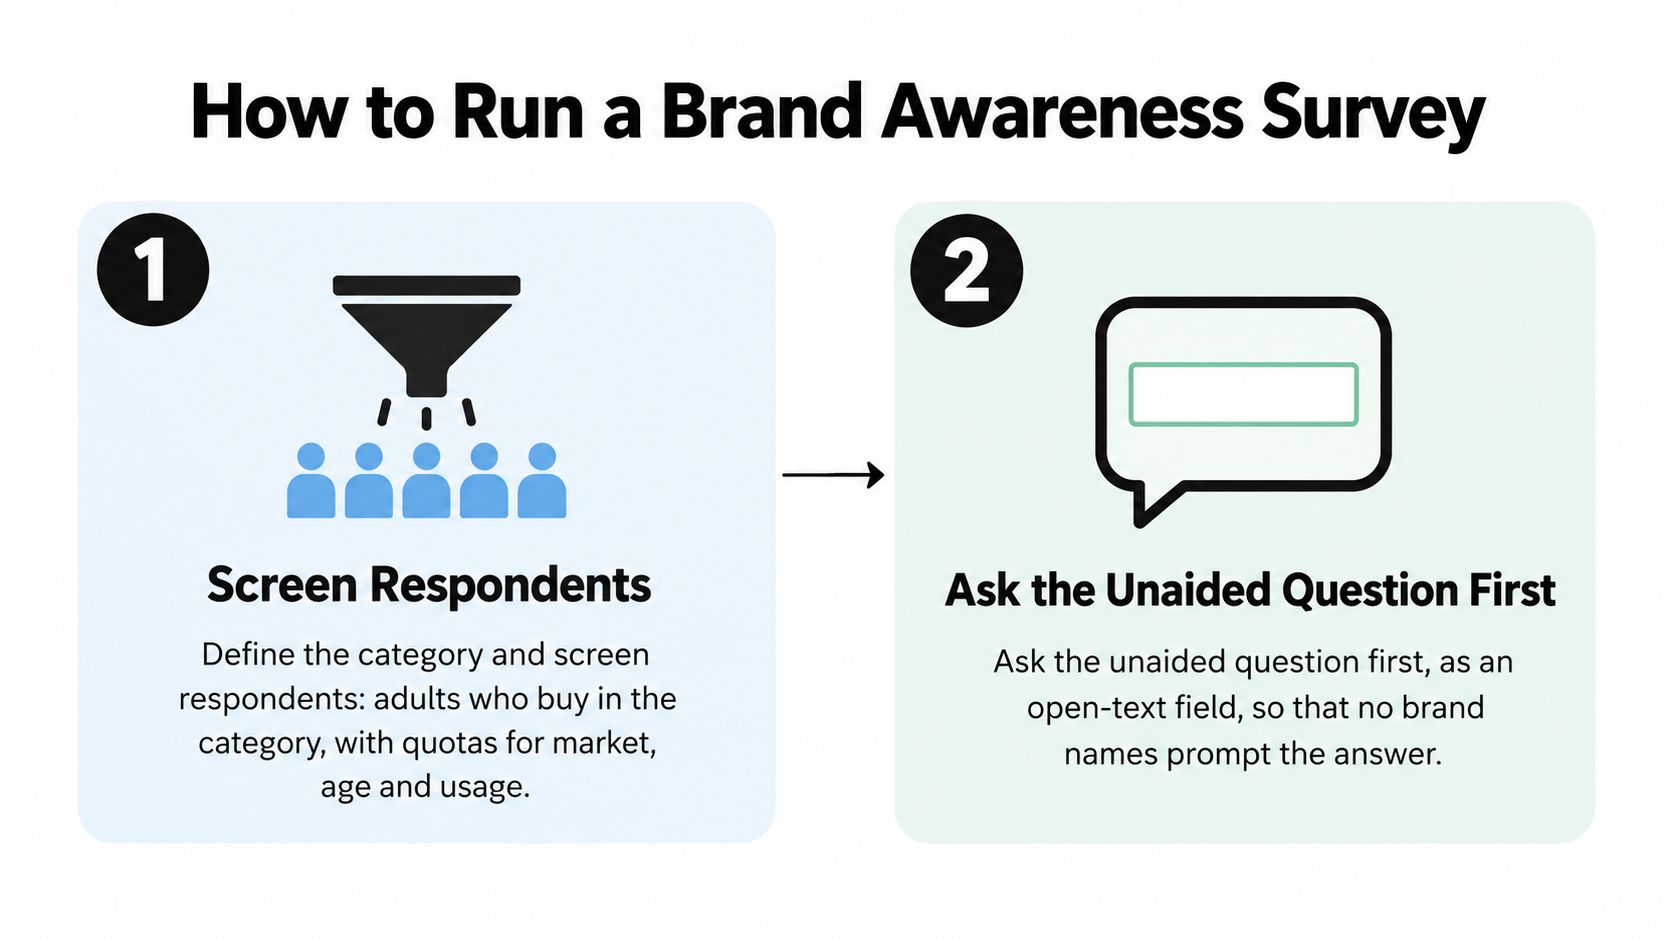
Define the category and screen respondents. Recruit adults who buy in the category, then set quotas for market, age, and usage. This keeps the results relevant to likely buyers rather than a broad pool of people who may not encounter the category.
Ask the unaided question first. Use an open-text prompt, such as “Which brands come to mind when you think of this category?” Don't show brand names or logos beforehand, because those cues can change what people recall.
Code answers consistently. Write a codebook for spelling variations, abbreviations, parent brands, and ambiguous responses. Have two coders apply it and reconcile disagreements, so a change in classification doesn't masquerade as a change in awareness.
Randomize the aided list. After the open-text question, show a randomized list of competitors and a few decoy names. Random order limits position bias, while the decoys help reveal whether respondents are claiming recognition indiscriminately.
Ask about consideration and usage afterward. These questions can help interpret awareness, but they may prime respondents to think about brands. Put them after recall and recognition so they don't contaminate the earlier answers.
Choose the sample for the decision. Set the sample size and any market or audience segments before fielding. A sample around 400 per market or segment gives a margin of error near plus or minus 5 percentage points at a 50 percent result, but the actual uncertainty depends on sampling and survey design.
Preserve the tracker between waves. Keep the category definition, wording, response order, competitor set, filters, and fielding channel the same. Compare results with a significance test before claiming change; otherwise, a survey adjustment could be mistaken for campaign lift.
Calculating Share of Voice and Reach
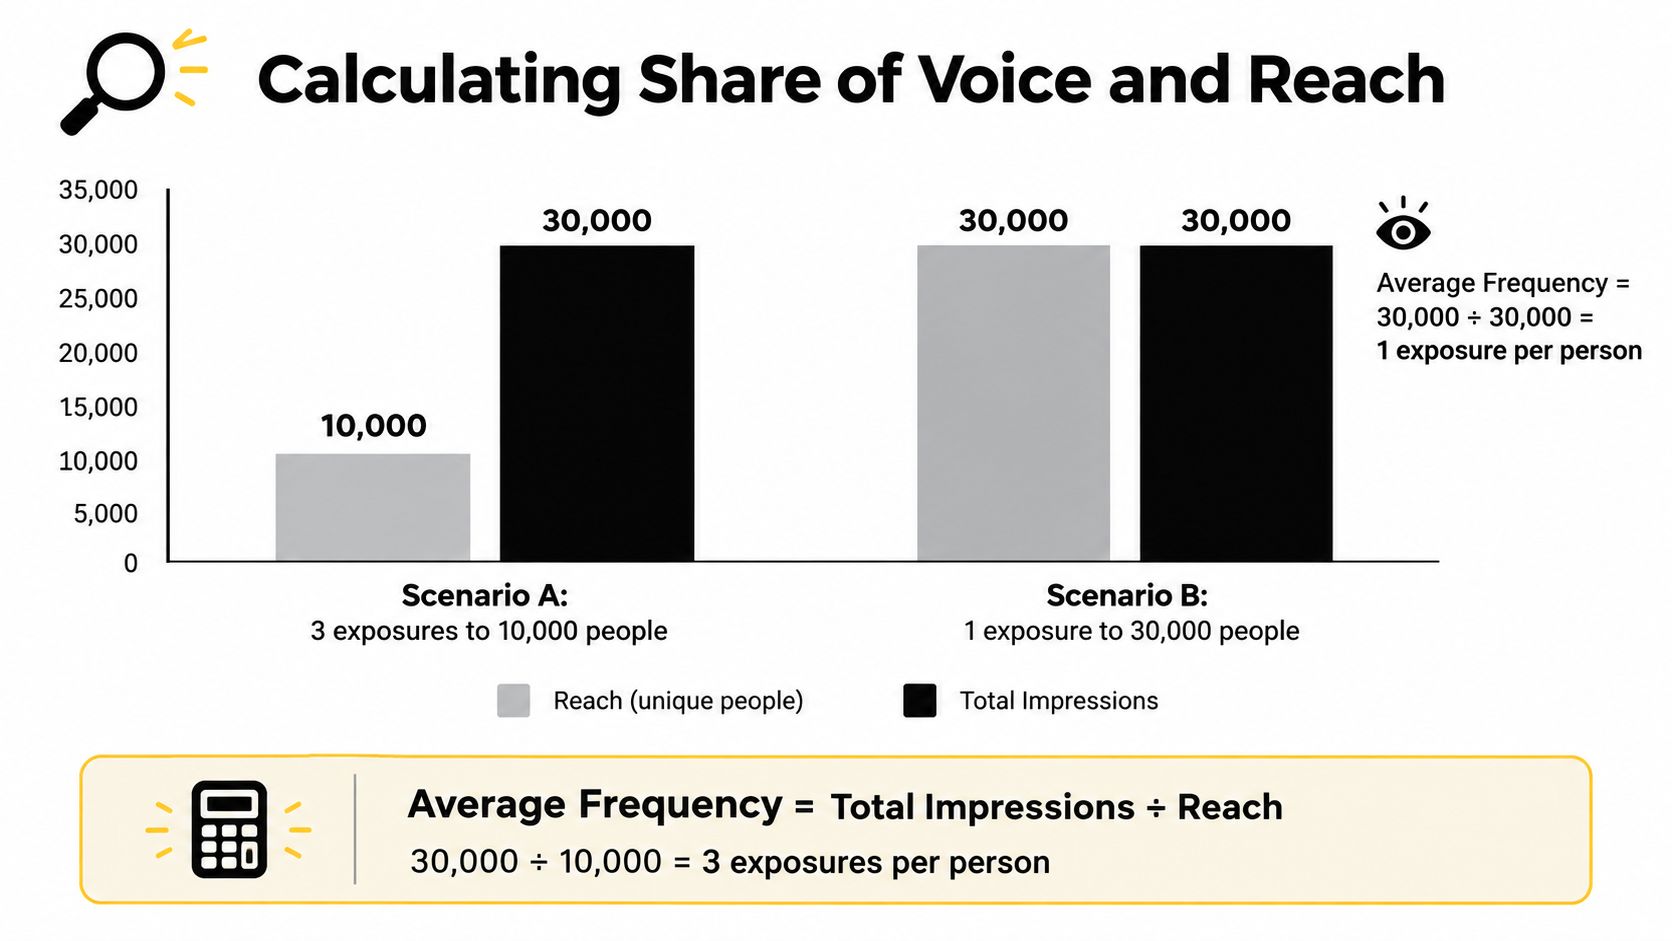
Average frequency = total impressions ÷ reach. Reach counts unique people exposed in the period; impressions count the total exposures, including repeat views. Three exposures to 10,000 people and one exposure to 30,000 people each produce 30,000 impressions, but they describe different delivery patterns.
For share of voice, suppose media monitoring finds 1,000 category mentions across news, reviews, and social posts during one month. If your brand has 180 mentions, its share is 180 ÷ 1,000, or 18%.
| Brand | Share of Voice |
|---|---|
| Your brand | 18% |
| Competitor A | 32% |
| Competitor B | 25% |
| Competitor C | 15% |
| All other brands | 10% |
The percentages add to 100%, making the denominator visible. To explore alternative ways to define and calculate this metric, use this guide to share of voice calculation methods. For social monitoring, decide which platforms and post types count; a consistent set of Twitter hashtags can help teams capture relevant conversations without changing the search rules mid-comparison.
Keep the comparison fair
Use the same source set and time window for every brand. Decide in advance whether to count a brand mentioned anywhere in an article or only in the headline, and keep that rule consistent. Tag mentions by sentiment, too: a high share of negative coverage signals visibility, but not necessarily favourable visibility.
Branded search volume needs the same care. Track your brand against the same competitor set over time rather than reading absolute growth alone. If searches for the entire category rise, your brand's volume may rise without gaining ground relative to competitors. Reach, share of voice, and search volume describe exposure or interest; none alone confirms that people can recall the brand.
Reading Aided and Unaided Results
Benchmarks need a defined sample and brand set: the BRAND 2024 database compiled 244,400 raw consumer responses from 2,000 U.S. consumers, covering more than 500 brands across 32 industries and containing 5,356 primary data points, as described in this overview of the BRAND 2024 dataset. Those figures show why a benchmark without its population, categories, and measurement period can mislead.
A mature category can set a useful reference point, but not a universal target. In a Statista survey of U.S. internet respondents, Pepsi had 95% aided brand recognition, while Coca-Cola and Sprite each recorded 94%, according to the U.S. soft-drink brand recognition results. A challenger with 40% aided awareness isn't failing because it trails those scores. Compare it with relevant category peers and its own baseline, and check whether the change is meaningful.
| Pattern | What It Suggests | Diagnostic Check First |
|---|---|---|
| High aided, low unaided | Recognized but not top of mind | Confirm category question wording and coding |
| Low aided, low unaided | Largely unknown in the category | Confirm the sample covers the target market |
| High aided, high unaided | Strong, mentally available brand | Check whether gains hold across segments |
| Aided rising, unaided flat | Exposure may be increasing recognition without improving spontaneous retrieval | Compare exposure timing with the survey window |
| Both rising in one segment only | Targeting may be working, wider reach is still needed | Confirm the segment definition didn't change |
Read the two scores together. A wide gap between aided and unaided results suggests that prompting brings out recognition that doesn't surface spontaneously; that's a different diagnosis from low scores on both measures. Before changing the content plan, check whether the brand list, sample filters, question wording, and open-text coding stayed consistent between waves.
Proving Awareness Lift Beyond Correlation
A rise in branded searches after a campaign doesn't prove the campaign caused it. News coverage, a price change, seasonal demand, or a competitor's stumble can all raise interest at the same time, and direct traffic can include existing customers. A trend is an observation, not an experiment.
Build an evidence ladder
Start with aided and unaided surveys before and after the campaign. That comparison shows whether measured recognition or recall changed, but without a control it can't separate the campaign from other changes in the market.
Next, compare the campaign market with a matched holdout market that didn't receive the activity. A geo-split test offers a stronger comparison when the regions are similar, and randomized exposure can provide a more direct test where it's practical. Controlled designs help estimate incremental recall, though outside influences and attribution noise don't disappear; this practitioner guide to measuring brand awareness sets out the value and limits of holdouts and geo-split tests.
Before fielding, decide the minimum detectable lift, the smallest change the study is designed to identify reliably. Report confidence intervals around each measured change, not just the point estimate. Then break results out by audience, market, channel, and time lag, because a blended average can conceal improvement in one segment and no movement, or decline, in another.
Decision rule: If there's no baseline and no holdout, report the observed change as a correlation, not a campaign-caused lift.
That may produce a less dramatic headline, but it gives the next decision a firmer basis. A small controlled test can be more useful than a dashboard full of metrics with no credible comparison. When teams review content performance metrics, they should pair the trend with a measurement design that can distinguish exposure from incremental memory change.
Turning Awareness Results Into Content Plans
Make each finding a testable content hypothesis. Record the pattern, choose the next content response, then attach the follow-up measure to the publishing slot before anything goes live. The finding should change an editorial decision, not sit in a report.
Weak unaided recall means buyers do not retrieve the brand when they think about the category. Build content around the problems they are trying to solve: guides, comparisons, and implementation pieces that attach the brand to those needs. High aided awareness with low unaided recall means people recognize the name when prompted but rarely retrieve it first. Reinforce distinctive associations through recurring formats, a named framework, or a consistent cluster around one problem.
AI-generated answers add an exposure channel, and some B2B teams now track visibility there as a success measure. Treat inclusion as an exposure signal until memory moves: a prompt panel can log whether the brand appears, gets cited, and is described accurately, while an independent survey checks recognition and recall. For adjacent topic monitoring, this guide to real-time content marketing insights can help teams spot changing material for editorial planning.
Organize B2B marketing examples by buyer question so the cluster mirrors how prospects search, compare, and justify a decision. Then test whether those topics make the brand easier to retrieve and describe accurately, since mention volume alone is an exposure metric.
Set Your Baseline Before the Next Launch
Start with a simple measurement pair: aided awareness from a randomized brand list and branded search volume compared against a small, consistent set of competitors. Record both before the next launch, using the same category definition, sample filters, and survey channel you'll use for the follow-up.
Write down the hypothesis, target segment, geography, and holdout or comparison market before publication. Schedule the follow-up after the content has had time to reach its audience, then add unaided recall once the baseline is stable enough to support a consistent comparison.
Keep the hypothesis, audience, geography, survey date, and result beside the publishing plan. That record makes it easier to see whether awareness moved and whether the content effort plausibly contributed.
TheContentMap gives editorial teams one place to capture ideas, schedule content, manage workflow, and review performance insights. Use TheContentMap to connect your awareness hypothesis and measurement dates to the content calendar, then carry the results into your next planning cycle.
Related Articles
Project Management Checklist for Editorial Teams: 10 Steps
The feature is due Friday. The writer never saw the approved angle, the legal reviewer is out, and t...
SoftwareContent Performance Metrics: What to Track, How, and Why
You've got a folder of published articles, a traffic report that doesn't look bad, and a mee...
SoftwareBest Editorial Calendar: Top 10 Tools for 2026
You opened the sheet this morning and the dates don't match the thread in Slack. A writer still...
Comments (0)
No comments yet. Be the first to share your thoughts.